Instrumenting Applications with Prometheus7 min read
Monitoring is an integral part of any non-trivial system, by the monitoring process, we then have an insight into the application performance and status, such as RPM, CPU usage, and various other kinds of metrics. Developing a monitoring system from scratch is hard and often not recommended. Luckily, there are many monitoring OSS out there that can help us take care of this part. One prominent example of the time-series data monitoring system is Prometheus. In this article, we will together figure out what’s Prometheus used for and a code example to demonstrate its key concepts.
Prometheus is an open-source monitoring system written in Go and originally developed by SoundCloud. It consists of multiple components, but in this article, we’re only interested in some of them:
- The Prometheus server scrapes metrics from an endpoint and stores the time-series data.
- Client libraries for instrument application code.
- PromSQL – the structured query language tailored to Prometheus.
In layperson’s terms, a metric is a numeric measurement of something, and time-series data are data that changed over time, for example, a stock price goes up and down through the day, the number of people currently visiting a website, the current temperature, etc…These are a good example of time-series data.
How does Prometheus work?
Basically, Prometheus works by scraping the HTTP endpoint periodically in a pre-defined interval. The application that you want to monitor needs to provide an endpoint so that Prometheus can scrape the data from it. Once the data is scraped, it is then persisted by the Prometheus server, and later metrics will be available for us to manipulate.
Prometheus is configured in prometheus.yml with the Yaml format, you can either change the configuration in the command line or this file itself, here is the default configuration:
global:
  scrape_interval: 15s # Set the scrape interval to every 15 seconds. Default is every 1 minute.
  evaluation_interval: 15s # Evaluate rules every 15 seconds. The default is every 1 minute.
  # scrape_timeout is set to the global default (10s).

# Alertmanager configuration
alerting:
  alertmanagers:
    - static_configs:
        - targets:
          # - alertmanager:9093

# Load rules once and periodically evaluate them according to the global 'evaluation_interval'.
rule_files:
  # - "first_rules.yml"
  # - "second_rules.yml"

# A scrape configuration containing exactly one endpoint to scrape:
# Here it's Prometheus itself.
scrape_configs:
  # The job name is added as a label `job=<job_name>` to any timeseries scraped from this config.
  - job_name: "prometheus"

    # metrics_path defaults to '/metrics'
    # scheme defaults to 'http'.

    static_configs:
      - targets: ["localhost:11133"]
The content of the file is relatively self-explanatory. In Prometheus terms, an endpoint from which Prometheus can scrape the data is called an instance. A combination of instances with the same purpose is called a job. In this example, I have a job name called prometheus , and with only one instance localhost:11133. With the global scrape interval of 15s, it will send a GET HTTP request to the localhost:11133/metrics endpoint.
In our application, we need a handler for the metrics endpoint, which returns the data in the text/plain format, its content must look something like this so that Prometheus can understand:
<metric name>{<label name>=<label value>, ...}The first part is the metric name that uniquely defines your metric, for example total_http_get_request, total_request_per_second, etc…And inside the curly braces, we have key-value pair labels, they are further used to differentiate the same metric name but with different label values. For example, total_request_per_second{method="get"}, compared with total_request_per_second{method="post"}.
Once Prometheus scrapes your data, it saves the data to its local database. Then we use a special query language called PromSQL that’s also a part of Prometheus to examine our time-series data.
An example: Age of Currency exchange rate
Now, let’s say we have a server that manages a collection of currency rates that need updating every single day, and we want to use Prometheus to help us keep track of their update status. If the currency’s rate is out of date for 1 day or more, we will then send some alerts to the Slack channel.
First, we have the simple Currency object:
public record Currency(String code, String name, BigDecimal fromUsdRate) {
    public static Currency create(String code, String name, BigDecimal fromUsdRate){
        return new Currency(code, name, fromUsdRate);
    }
}
Then we have Currencies which holds Currency objects and also the latest update time:
public record Currencies(List<Currency> currencies, LocalDateTime lastUpdated) {
    public static Currencies create(List<Currency> currencies, LocalDateTime lastUpdated) {
        return new Currencies(currencies, lastUpdated);
    }
}
And now we need to define the metric that we want Prometheus consumes, in this case, we want to measure the currencies’ age, the calculateCurrencyAge function below gives us exactly that:
public long calculateCurrencyAge(Currencies currencies) {
        checkNotNull(currencies);
        checkNotNull(currencies.lastUpdated());
        List<Currency> currencyList = checkNotNull(currencies.currencies());
        if (currencyList.isEmpty()) return -1L;
        long now = System.currentTimeMillis();
        long lastUpdate = currencies
                .lastUpdated()
                .toInstant(ZoneOffset.UTC)
                .toEpochMilli();
        return now - lastUpdate;
}
Next, we need to provide an endpoint, in this case, is the /metrics so that Prometheus can read metrics from our application, but first, let’s familiarize ourselves with the metric types that Prometheus uses:
- Counter: a monotonically increasing counter that can either be increased or set to zero when on restart.
- Gauge: holds a single numeric value that can arbitrarily go up or down.
- Histogram: samples observations and counts them in configurable buckets.
- Summary: similar to a histogram, but also calculates configurable quantiles over a sliding time window φ-quantiles (0 ≤ φ ≤ 1).
Since the age of the currency rates can go up and down every time examine the value, using a Gauge is a valid option for us. All the metric types are already provided by the client libraries, in this case, we use this to instrument our application:
private static final Gauge LATEST_CURRENCY_AGE = Gauge.build()
            .name("latest_currency_age")
            .labelNames("from_rate")
            .help("Gauge the freshness of the currency rates")
            .create()
            .register();
We’ve just created our gauge that has the metric name latest_currency_age, and also one label named from_rate, we register the metric to the default registry.
Our gauge is ready to receive numeric value, let’s create a job that will run every 6 hours to check our currencies’ status and save the value to our gauge:
scheduleThreadPool.scheduleWithFixedDelay(() -> {
    long age = currencyService.calculateCurrencyAge(currencies);
    LATEST_CURRENCY_AGE.labels("USD").set(age);
}, 10, 60L * 60 * 6L, TimeUnit.SECONDS);
Now our gauge will be populated with some values every 6 hours, our final step is to create an endpoint that exposes this metric to Prometheus:
@GetMapping(value = "/metrics", produces = MediaType.TEXT_PLAIN_VALUE)
public String getMetrics() {
     StringBuilder sb = new StringBuilder();
     double val = LATEST_CURRENCY_AGE.labels("USD").get();
     sb.append("latest_currency_age").append("{")
                .append("from_rate=")
                .append("\"")
                .append("USD")
                .append("\"")
                .append("}")
                .append(val)
                .append("\n");
     return sb.toString();
}
That is how you can expose metrics to Prometheus, and the Prometheus server should be running, you can download it here. Once the Prometheus server starts and is ready to serve requests, usually it runs on port 9090, navigate to localhost:9090/graph it you give you the GUI interface that we can query our metrics:
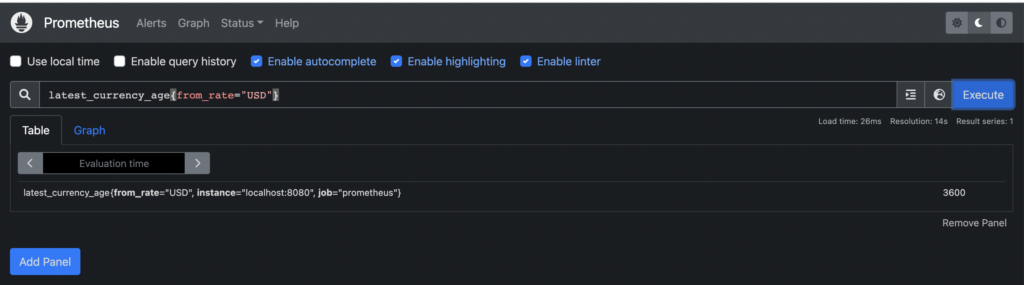
By default, labels job and instance labels are automatically provided for us. Prometheus will scrape our /metrics endpoint every after 15 seconds and we are now seeing our currency age has been about 1 hour. The input takes a valid PromSQL expression, there are multiple possibilities that we can play along with it, however here we try to make it simple.
Prometheus usually is used as a data source for many monitor platforms, one example is Grafana, which supports Prometheus as a data source out of the box. Basically, Grafana helps us visualize the data source and also sends alerts to our communication channels such as Mail or Slack.
